Simple Graphs with Arbor.js

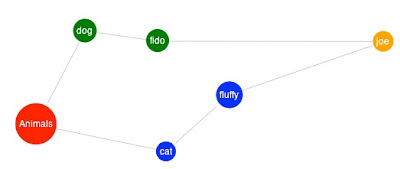
We recently released a tool at http://cc.thinkst.com to capture and collect infosec conference details. We commented on it [ here ]. One of the cooler components of it, is the ability to view the relationships between speakers/researchers who have collaborated. This post is a quick introduction to the library we used to build our graphs, with enough info to get you up and running in minutes. As I mentioned, we use ArborJS library which is a a graph visualization library using web workers and the popular jQuery . The API is really well documented [ here ] but like most people, I learn best by example (and there are precious few of these). Hopefully this post will fill that niche, and by the end of it you should have a basic understanding of how to use arbor.js in your project. Our Aim: We will be building a simple contrived example as seen in the image above. Project setup : Create a new html page and include script references to the following libraries (Download them from the links...
